Theia is a team project that focuses on camera-based position tracking in museums. In collaboration with the Kunstsammlungen & Museen Augsburg, Theia has developed a tracking system that not only collects the necessary data, but also presents it visually.
I was responsible for: User Research, UX and UI Design, Corporate Design, Head of Design Team, Project Management
Team: Julia Mehrer, Christine Weinhardt, Dominic Storl, Maximilian Schunck, Valentin Rogg
1 PROBLEM AND PROJECT GOALS
The mission of museums is to make art and culture accessible to the general public. When planning exhibitions, museum directors and curators give a lot of thought to which exhibits to display and how to present them in order to best convey the content to visitors. The difficulty is to be challenging and interesting at the same time, to fulfill a certain educational mission and to meet the tastes of the visitors. The question is how a museum can find out what is particularly well received by visitors to an exhibition and what is less well received. With this knowledge, the exhibition can easily be improved or promoted in a more appropriate way.
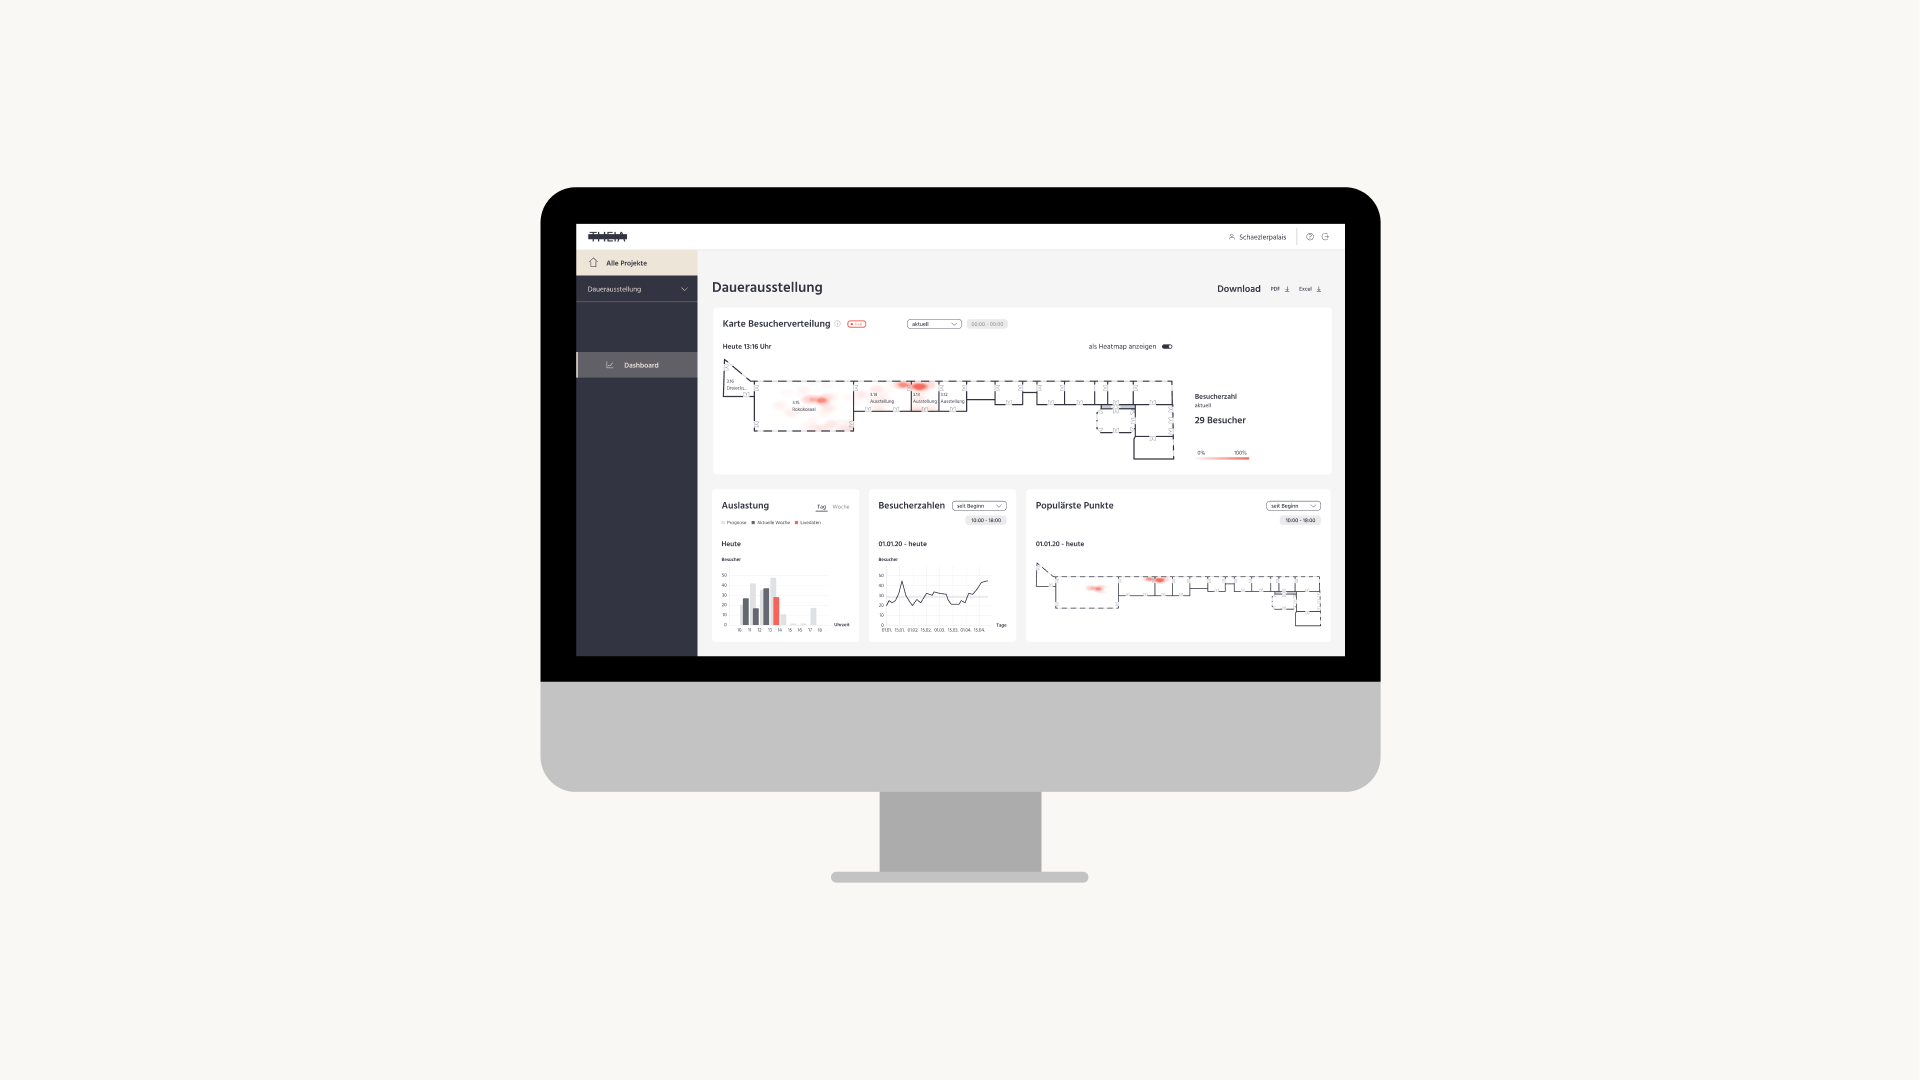
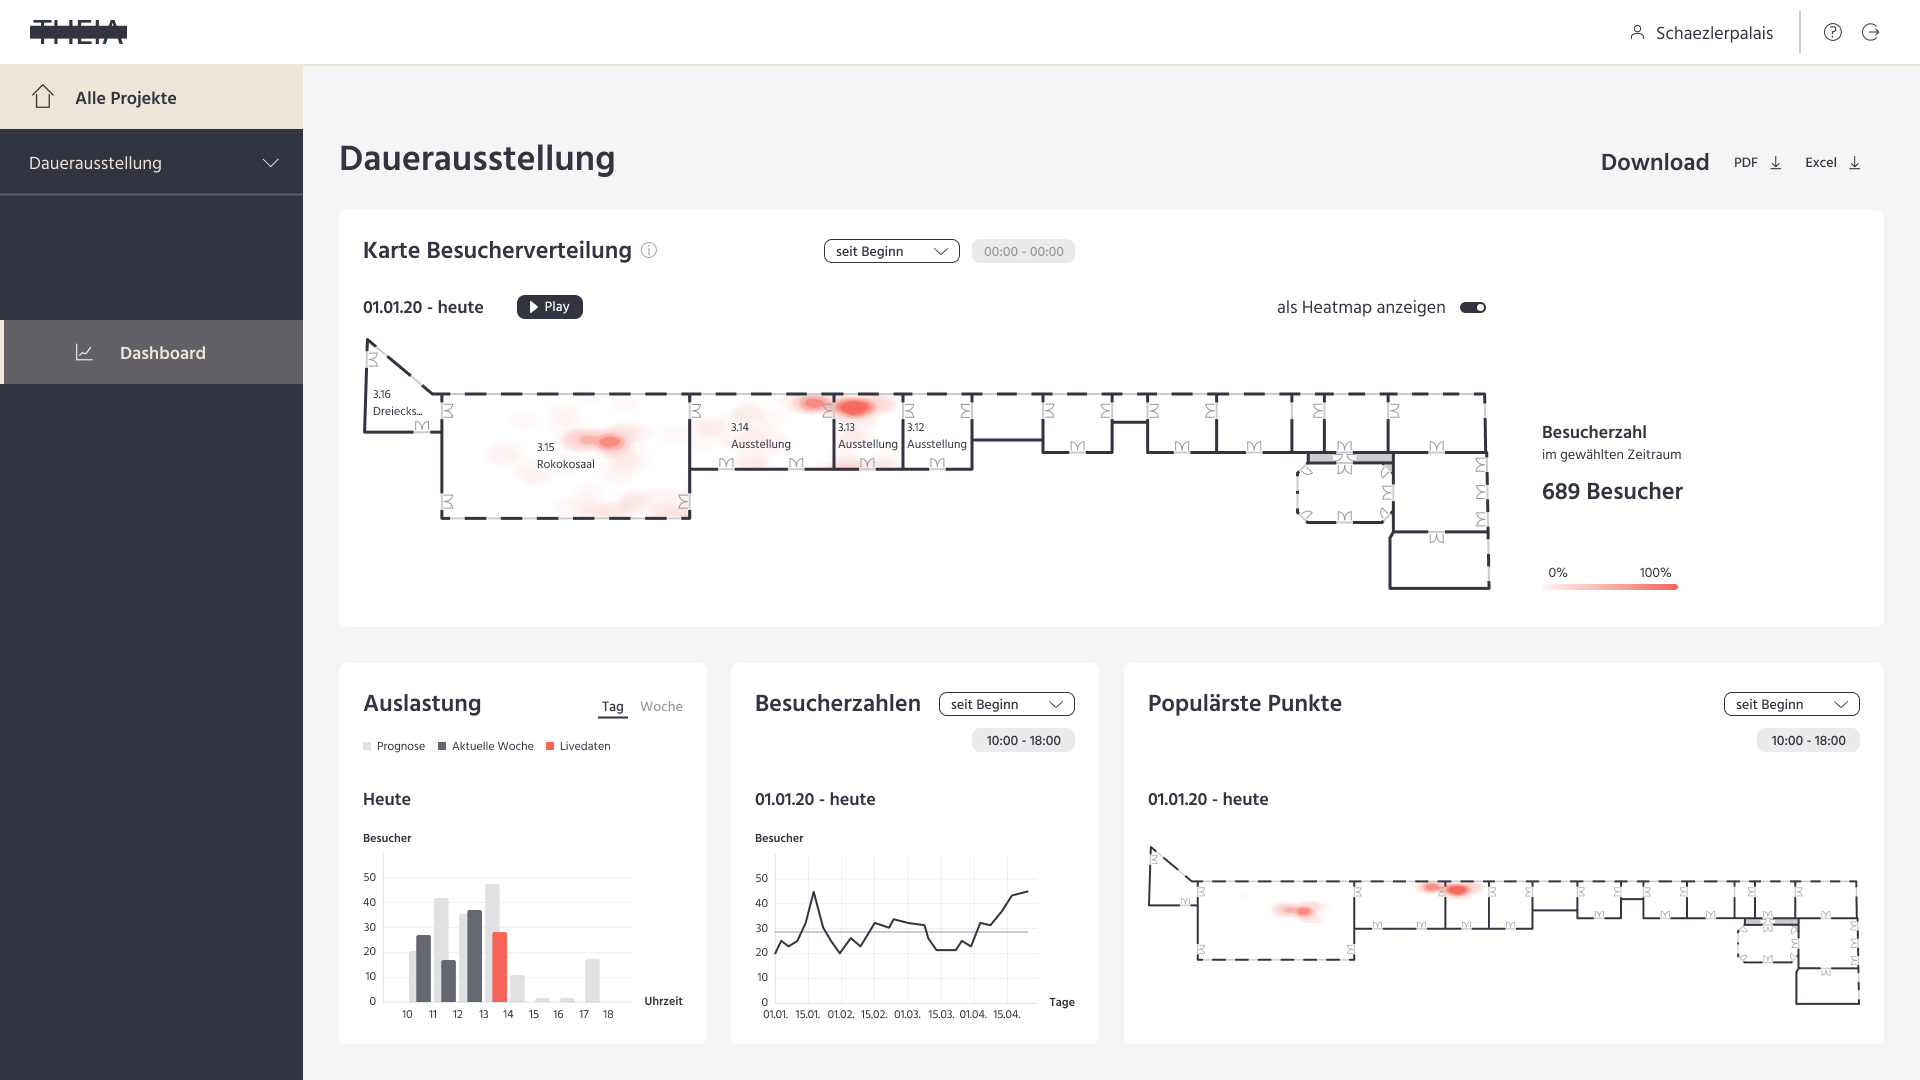
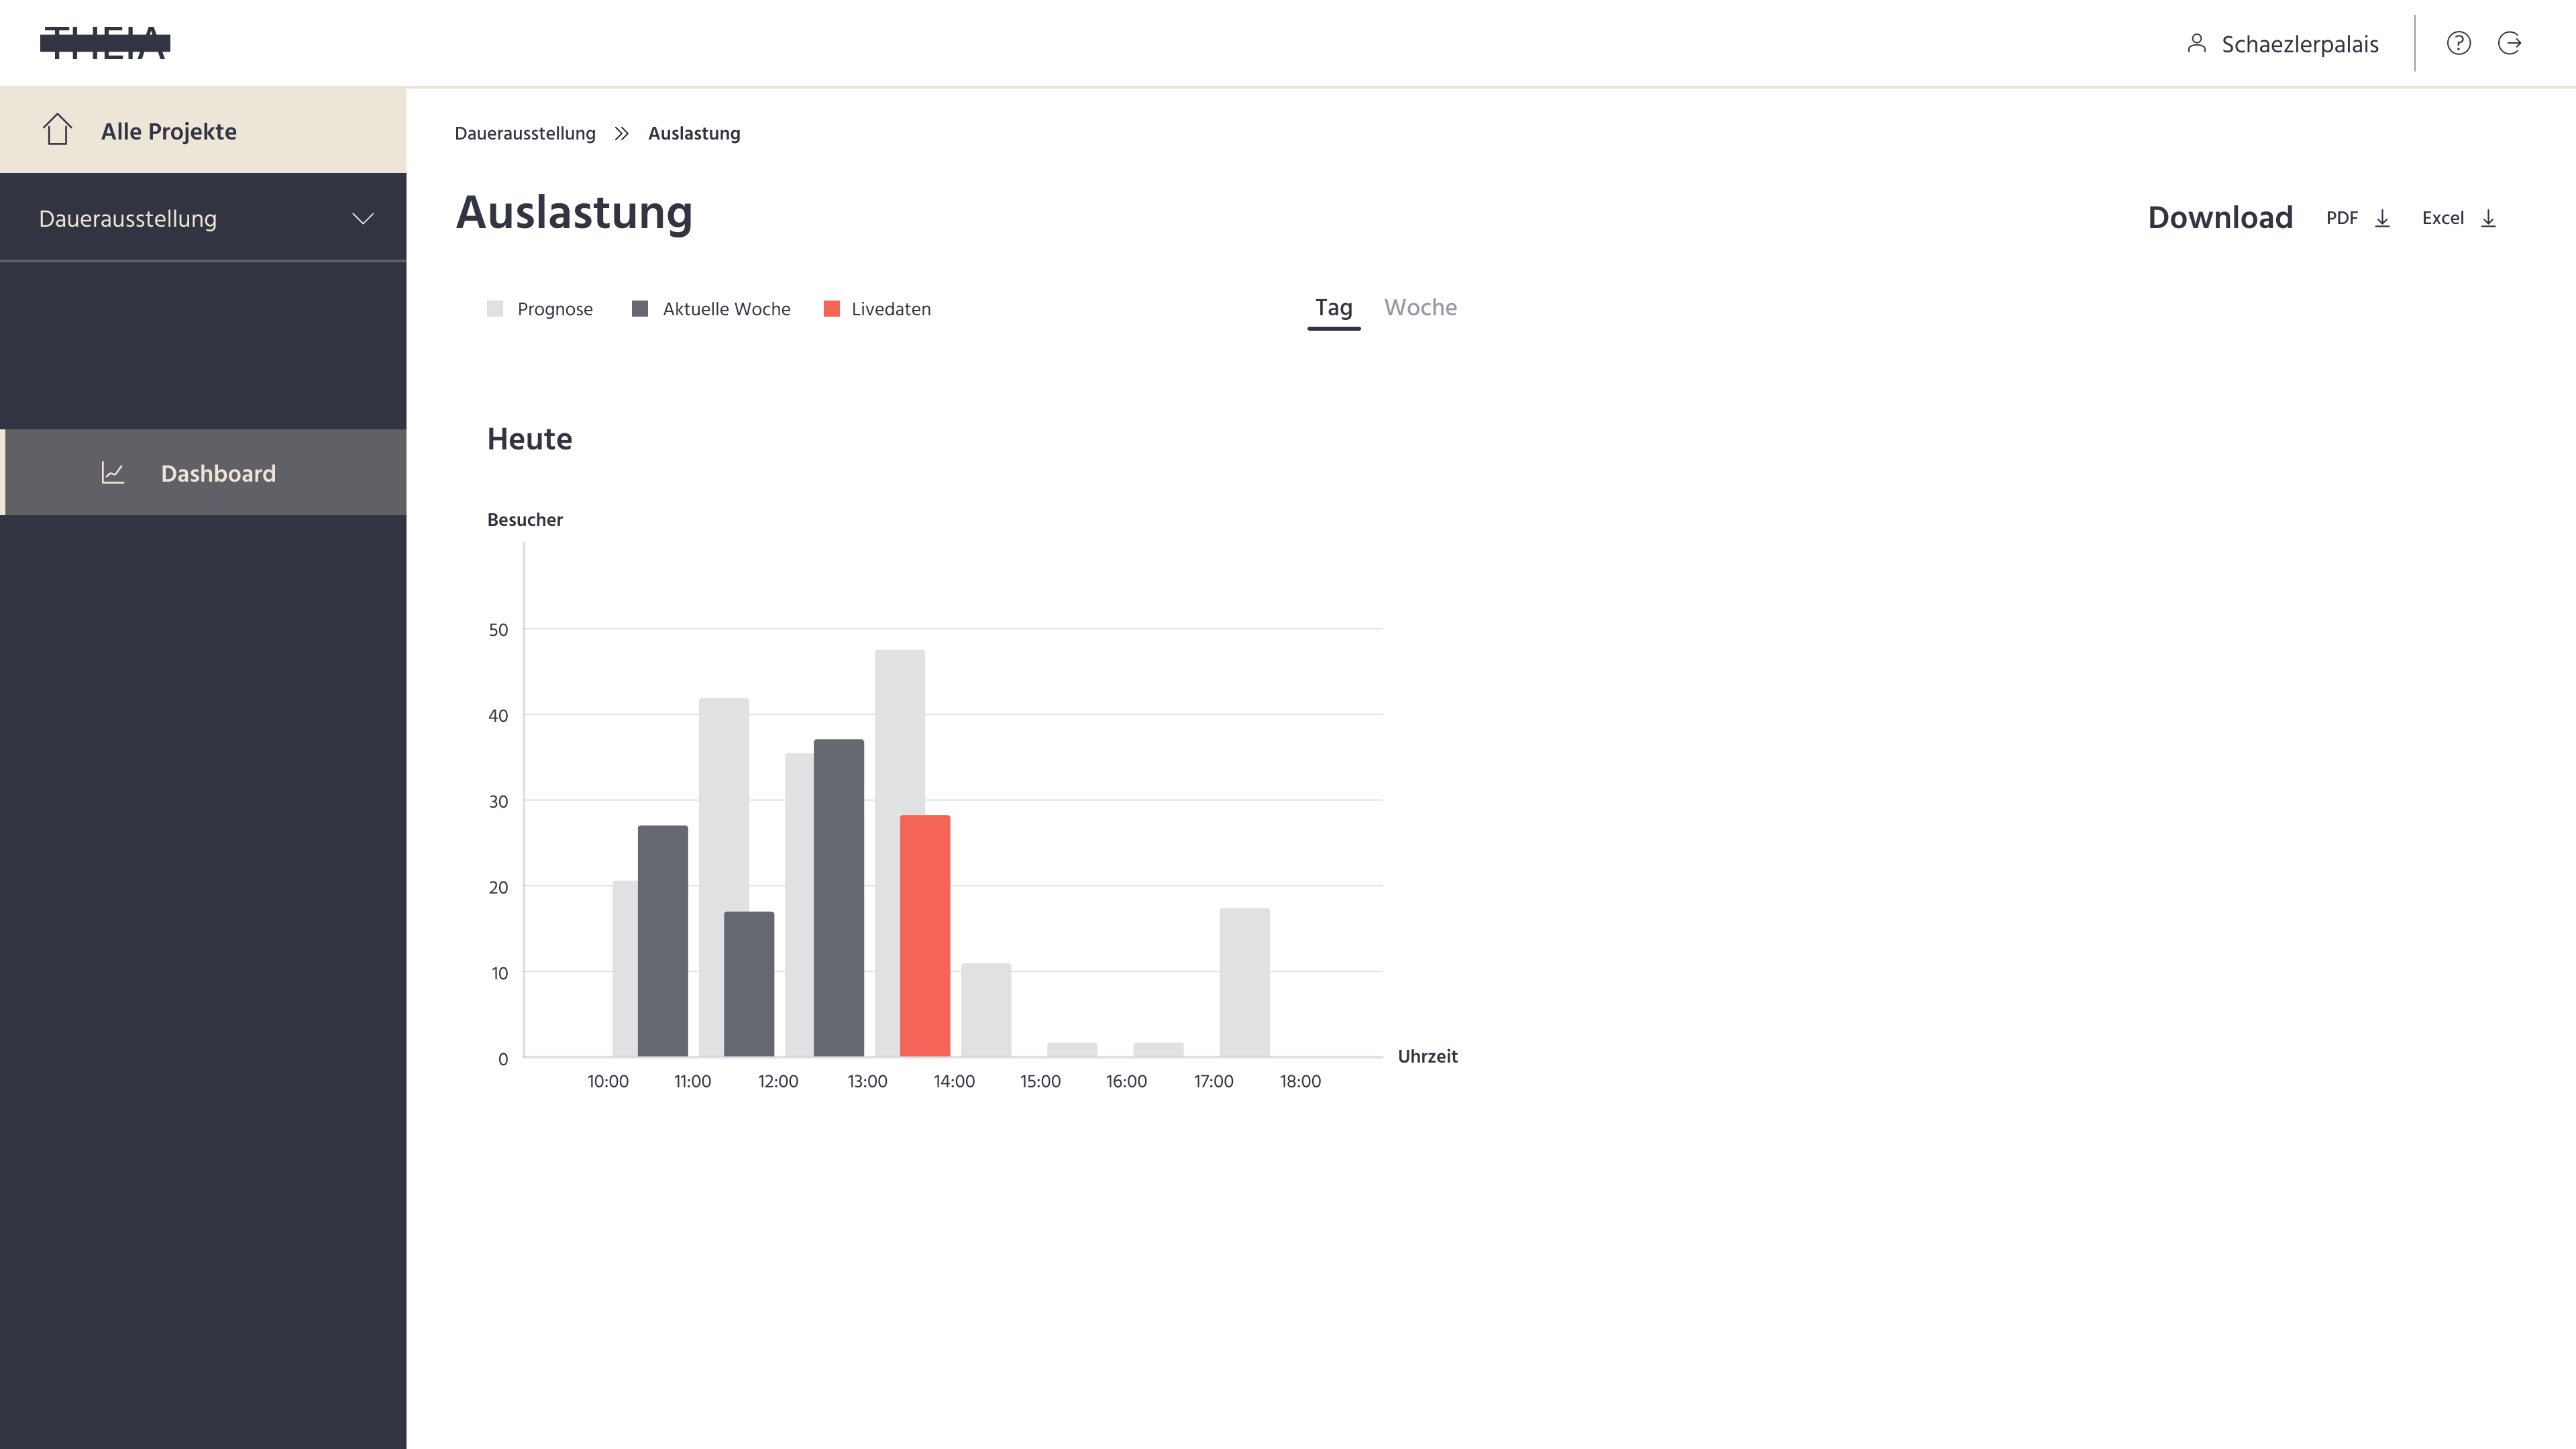
The end product should be a MVP (Minimum Viable Product) of a web-based dashboard that gives museum staff an overview of the number and location of visitors in the exhibition spaces. The data should be presented in a variety of graphs and statistics so that museum staff can draw immediate conclusions for their exhibition.
2 PROCESS
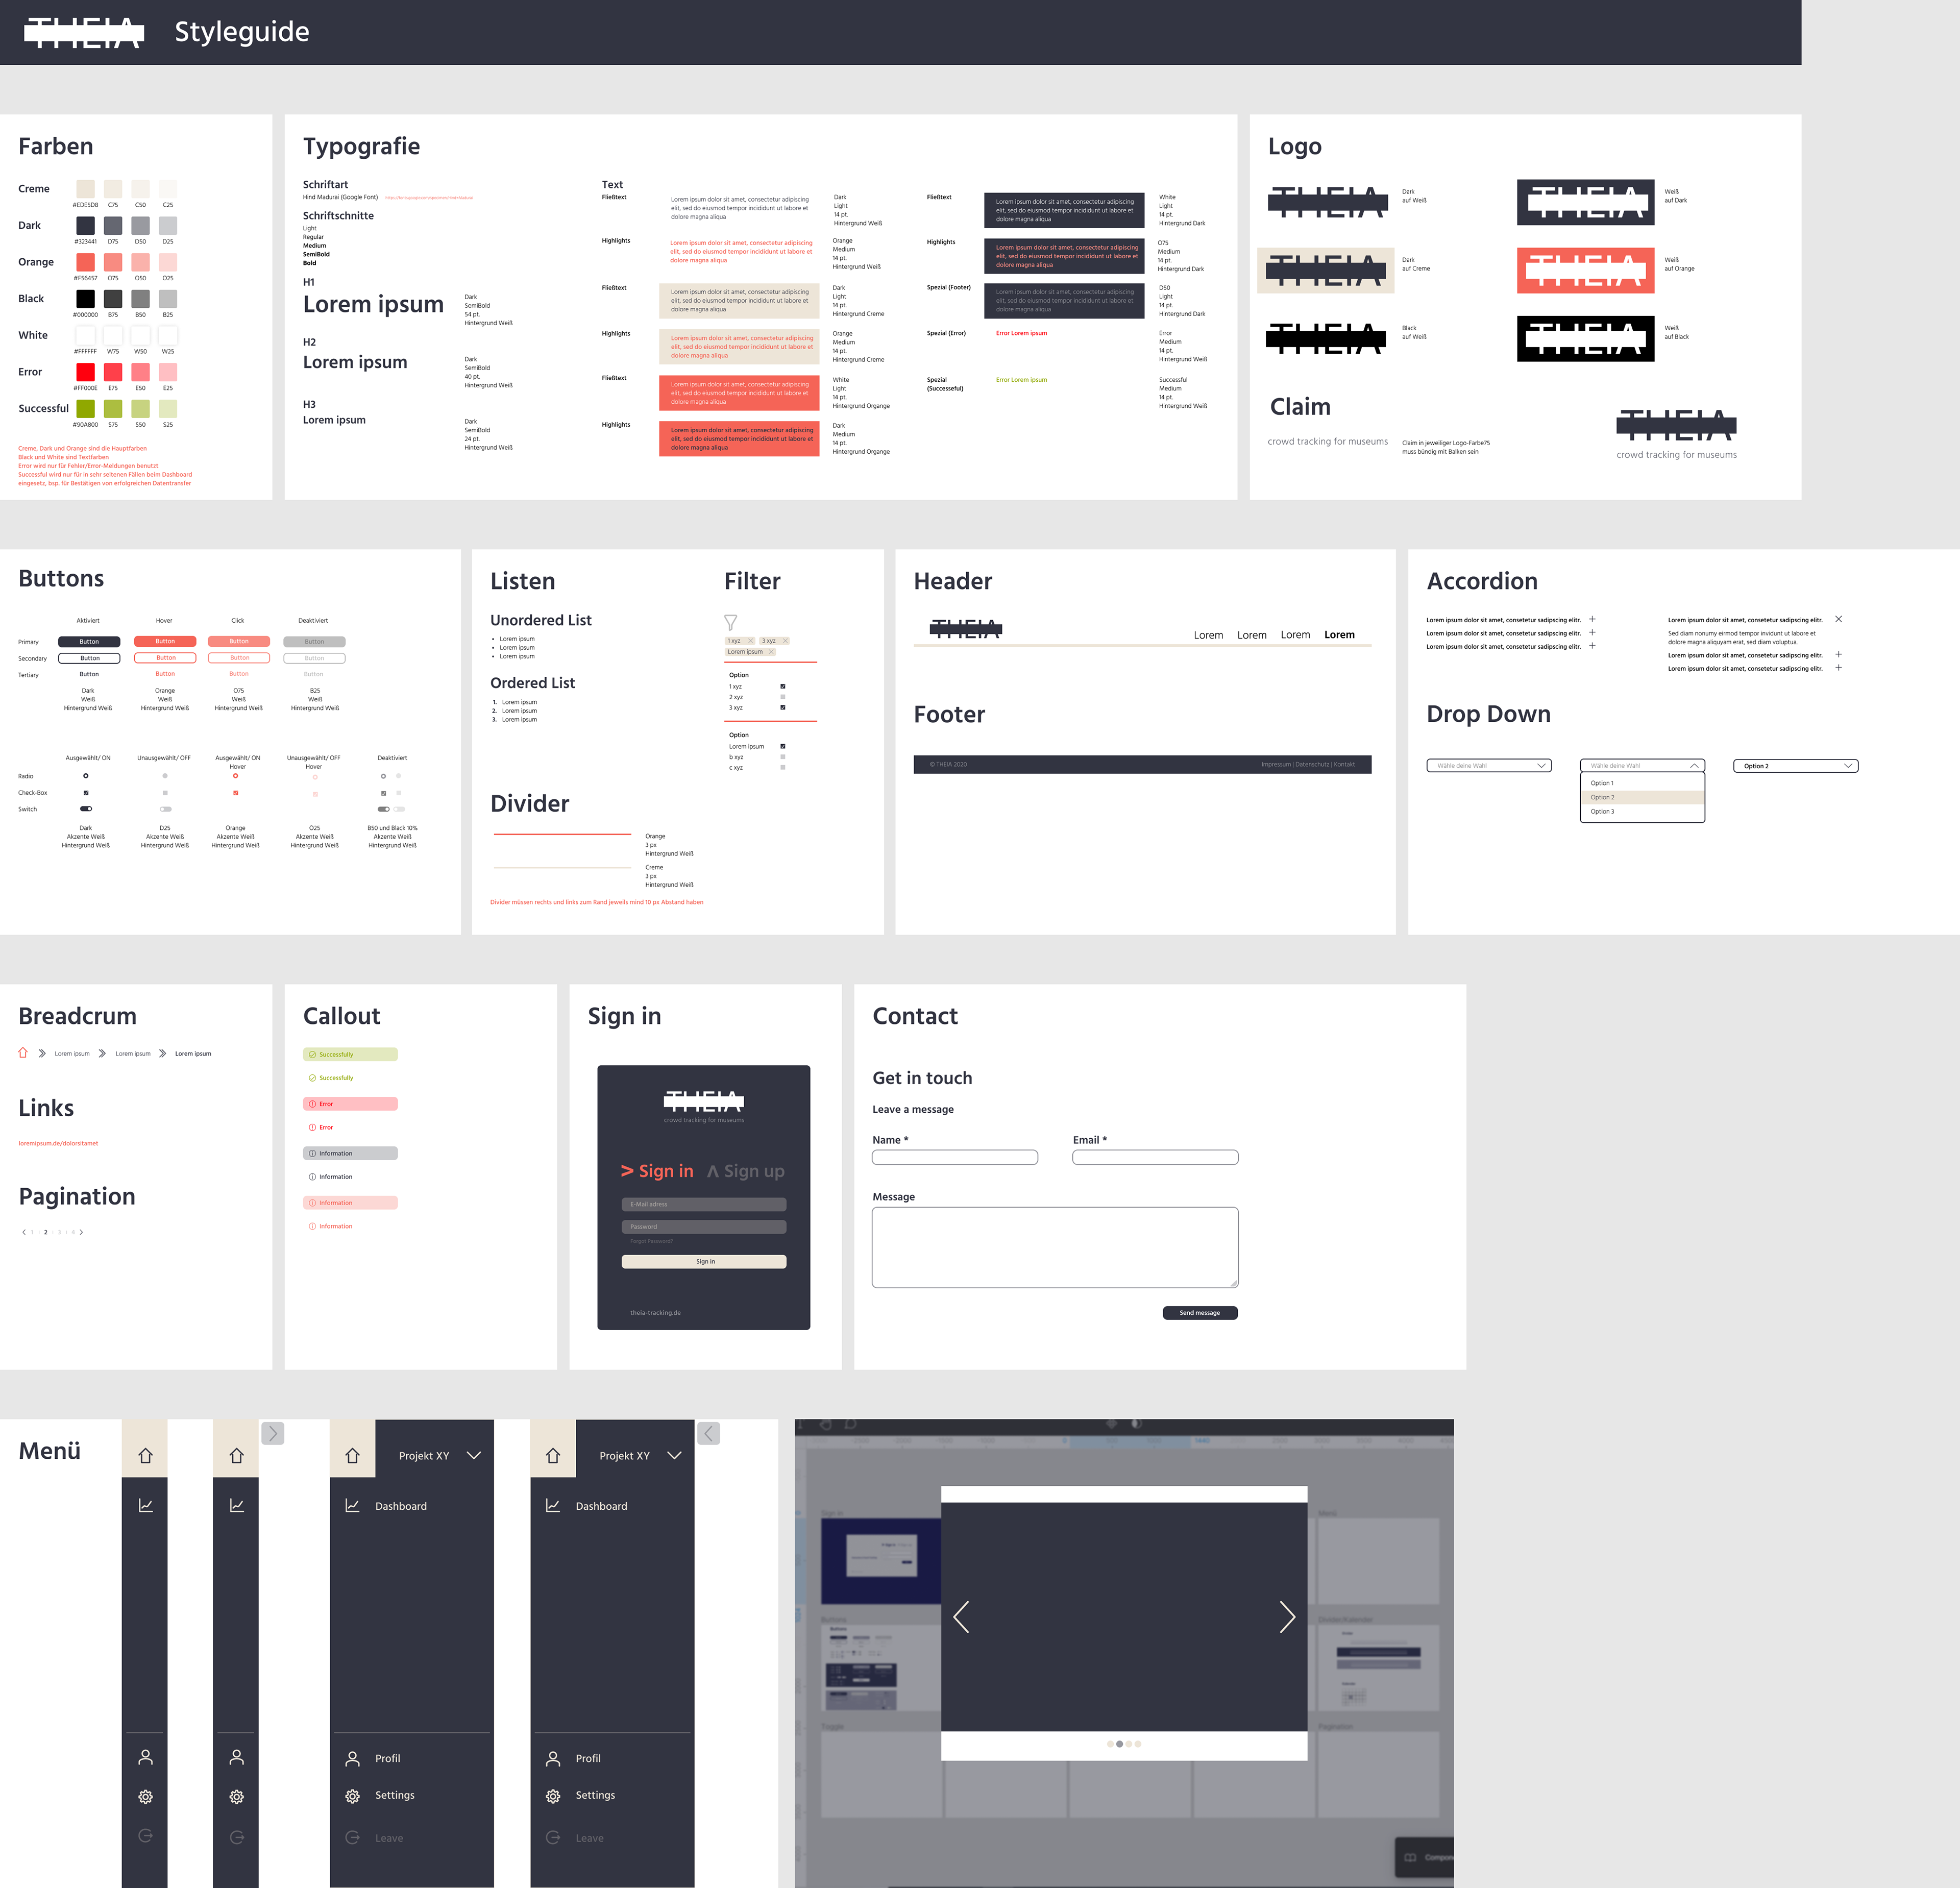
To ensure a consistent brand identity across different media, we, the design team, developed a style guide. We focused on creating a consistent design language for our dashboard, project website, presentations, and explainer video. To do this, we first defined and aligned our logo, colors, typography, UI elements, and illustrations. This process allows us to present a strong and cohesive brand identity across all platforms.
Together with my fellow student Julia Mehrer, I was responsible for the UX design.
Our goal was to develop a user interface for the Theia Dashboard that is both useful and user-friendly. To better understand the needs of the target audience, we conducted user interviews with directors and curators of the Kunstsammlungen & Museen Augsburg.
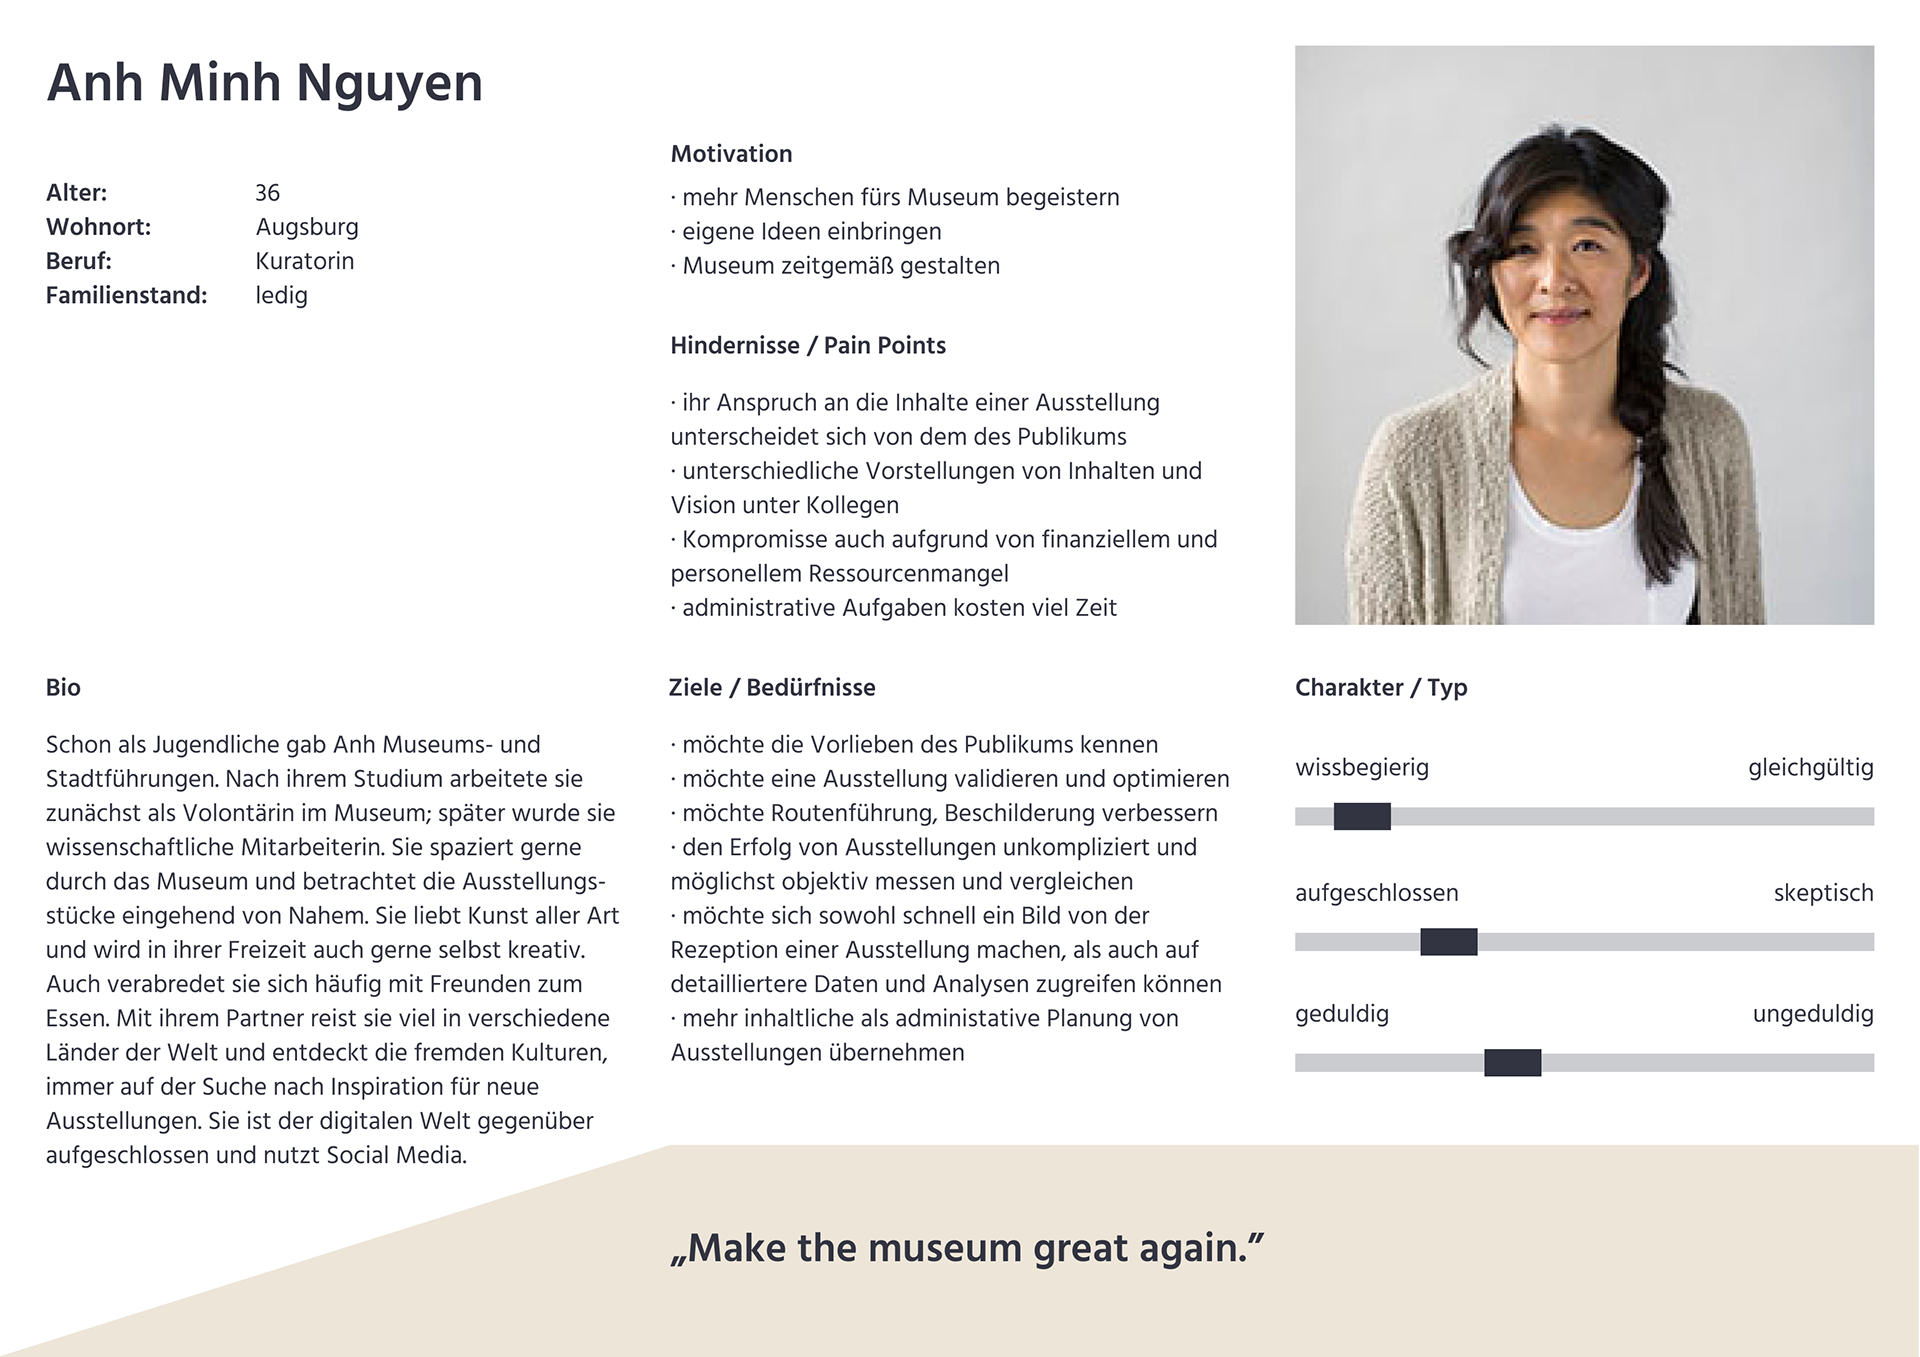
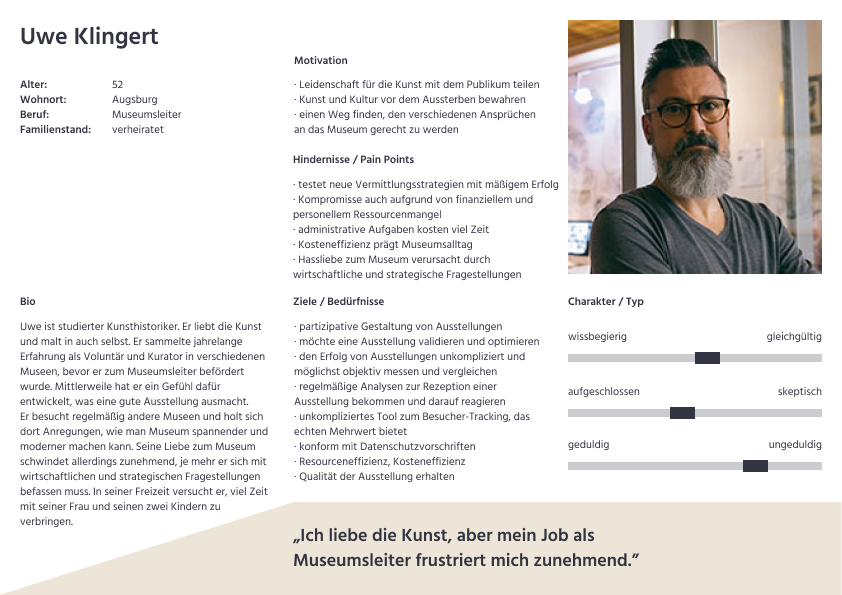
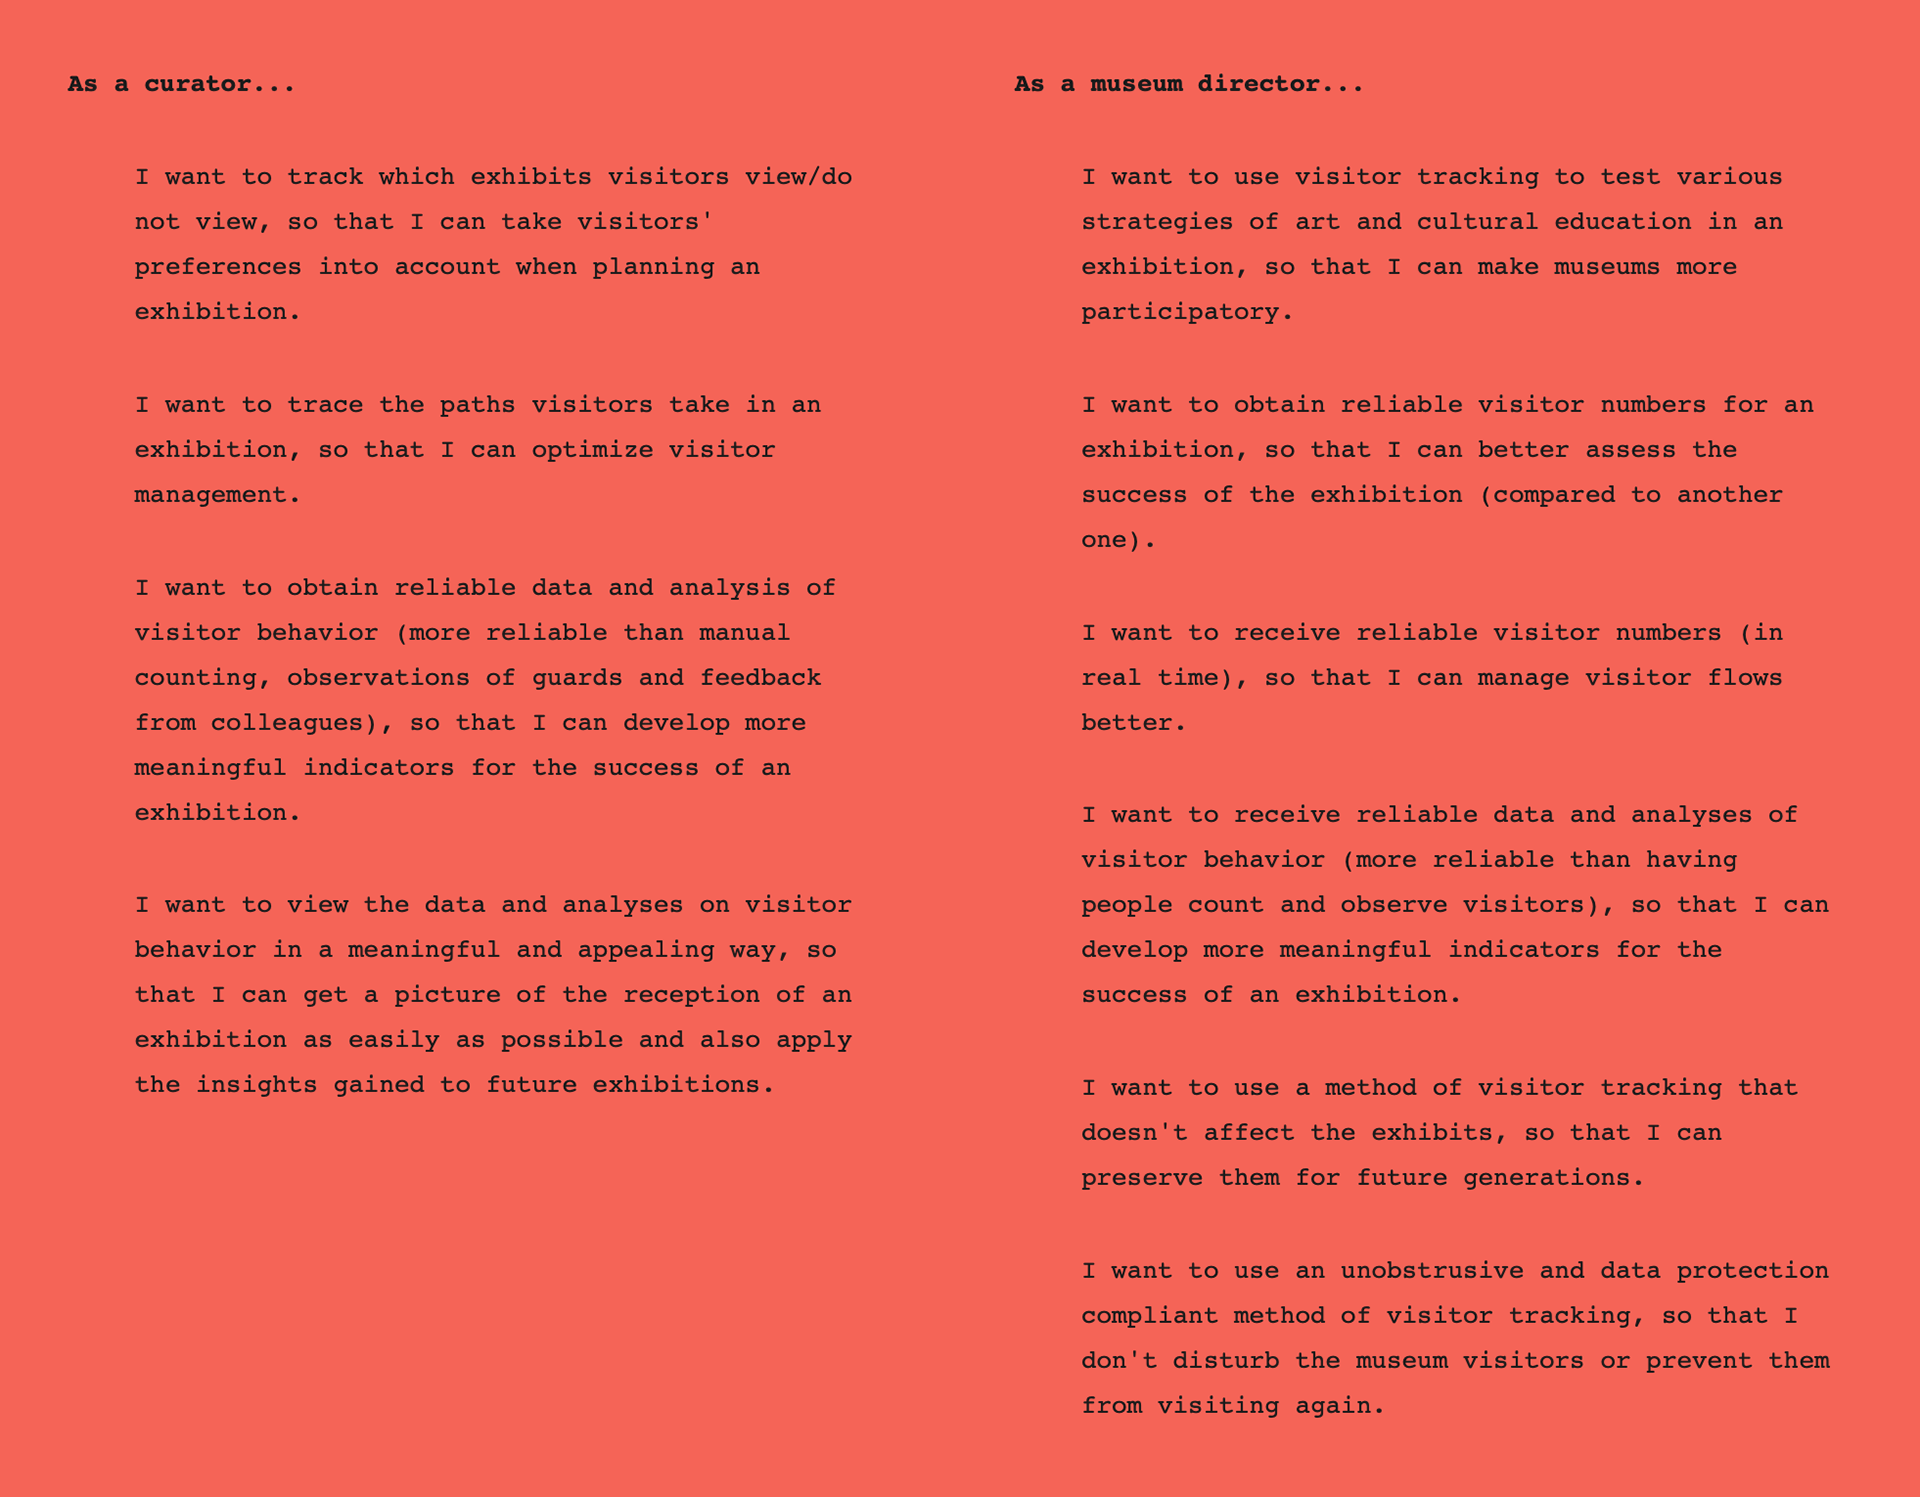
In the interviews, we asked about the challenges museums face in their daily work, how they collect feedback from their visitors, and why it is important to take a closer look at visitor behavior in an exhibition. We also explored what information museum staff need from visitor tracking and what opportunities and risks they see in monitoring visitor behavior. The interviews also provided insight into the technical affinity of museum staff. Based on these findings, we created personas for curators and museum directors, as well as user stories. These were used as a guide for the evaluation of the product phases throughout the design and development process to ensure that the Theia Dashboard would meet the needs of the users.
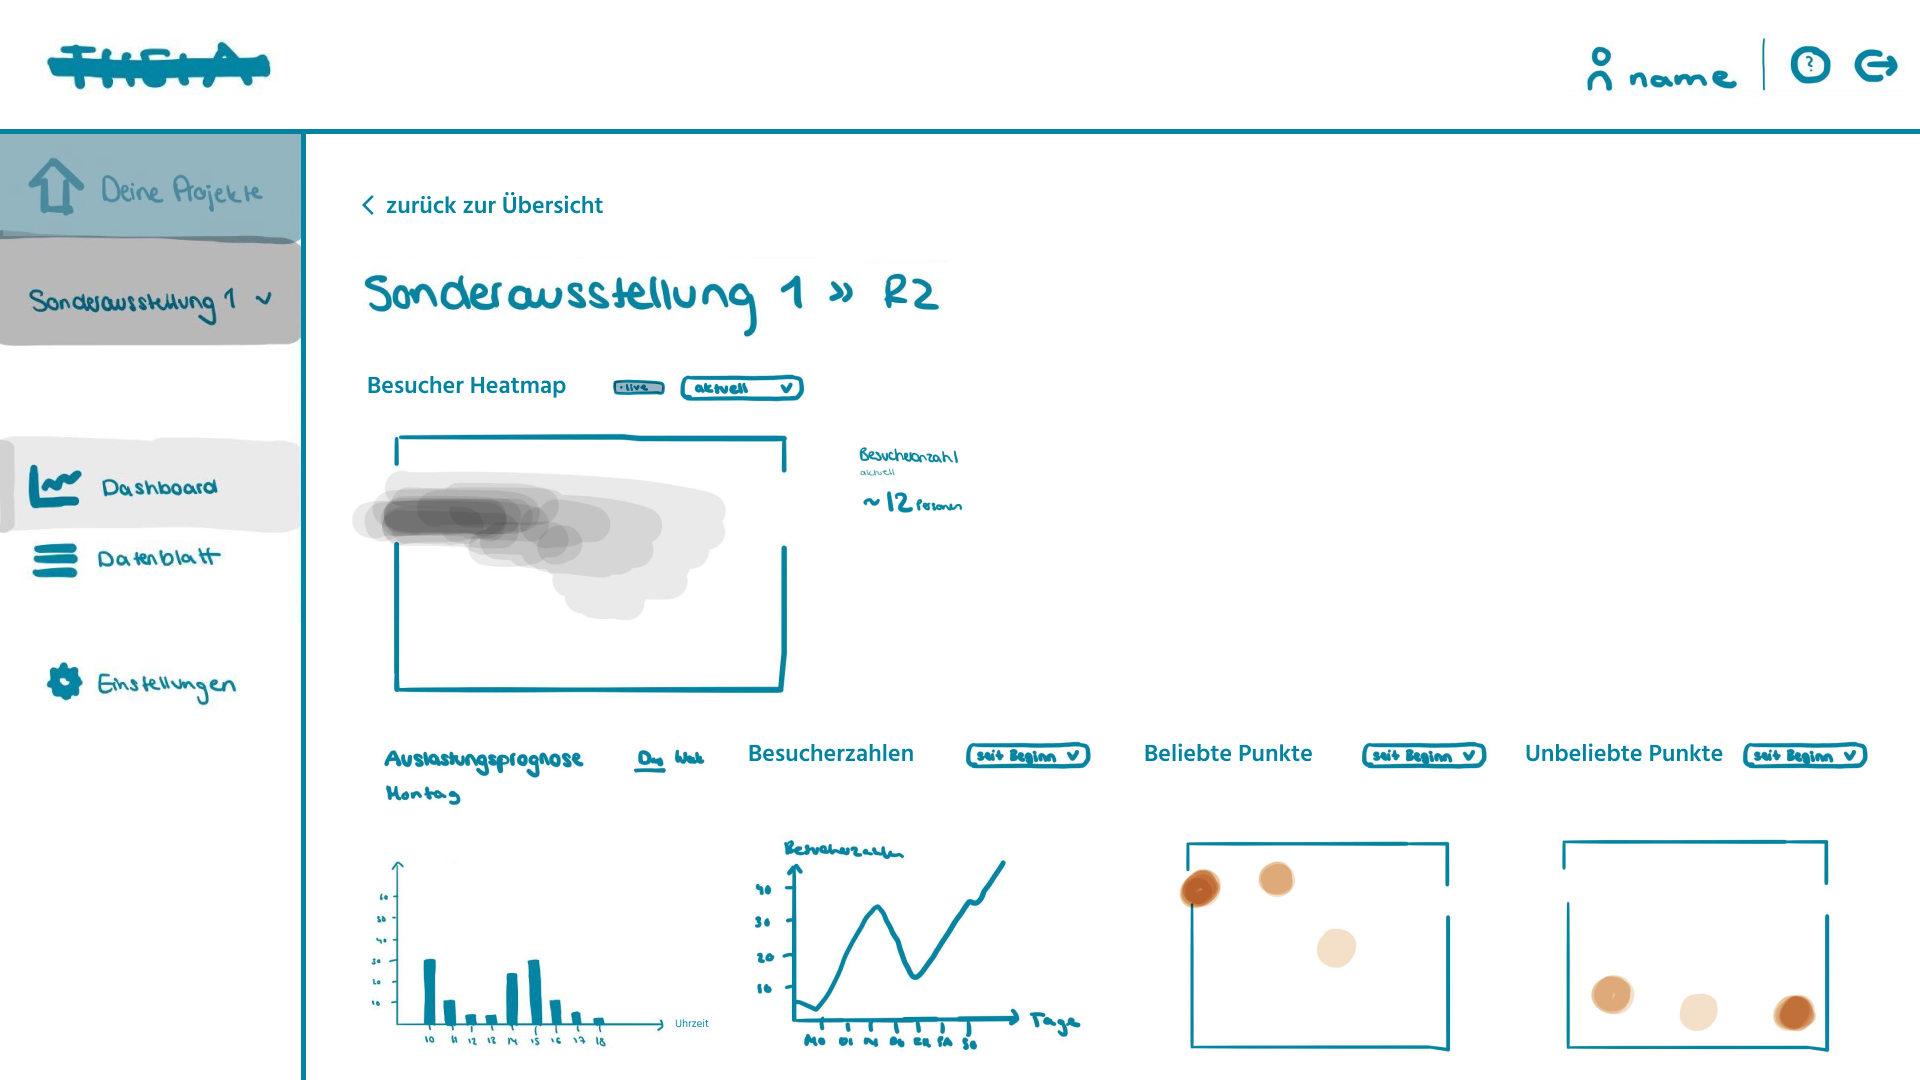
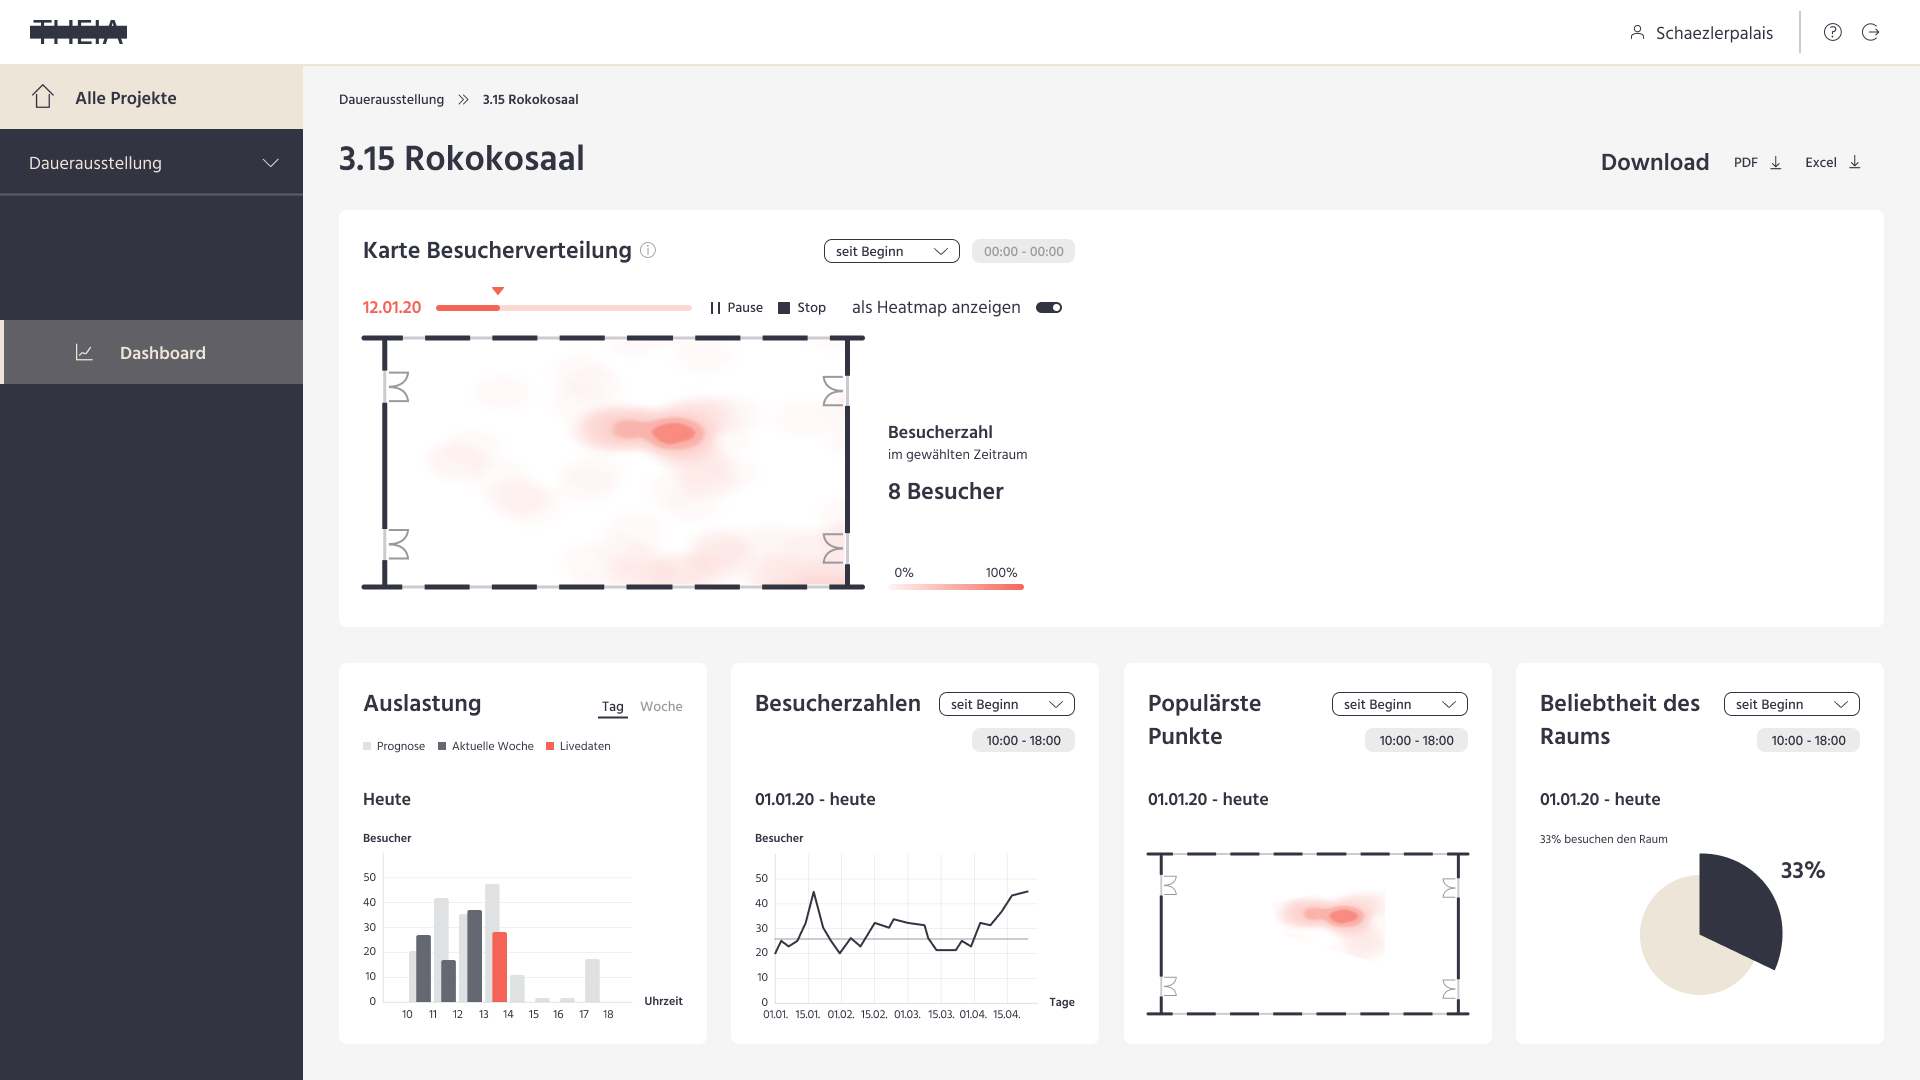
To make the operation of the dashboard as intuitive as possible, the required functions were identified and an attempt was made to generate a logical structure from them. The structure should be designed in such a way that, in addition to the basic functions, new functions can be easily integrated in future developments without having to change the basic structure of the platform. We first created a low-fi prototype of the Theia tracking dashboard to understand the content and structure before moving on to the high-fi prototype. We tested our prototypes to see if they were viable and usable for museum directors and curators, and where there were issues to be addressed. The exhibition dashboard allows users to view the quantitative data collected in a variety of graphical representations. Analyses are based on crowd tracking and are available for the entire exhibition as well as for individual rooms.
Usability testing was used to determine which features were needed by museum staff and which were not, as well as to uncover any problems with navigation through the application or comprehension of the content. In the end, users should be able to interact intuitively with the application, easily get to the information they need, and read it correctly in the diagrams provided.
3 SOLUTION
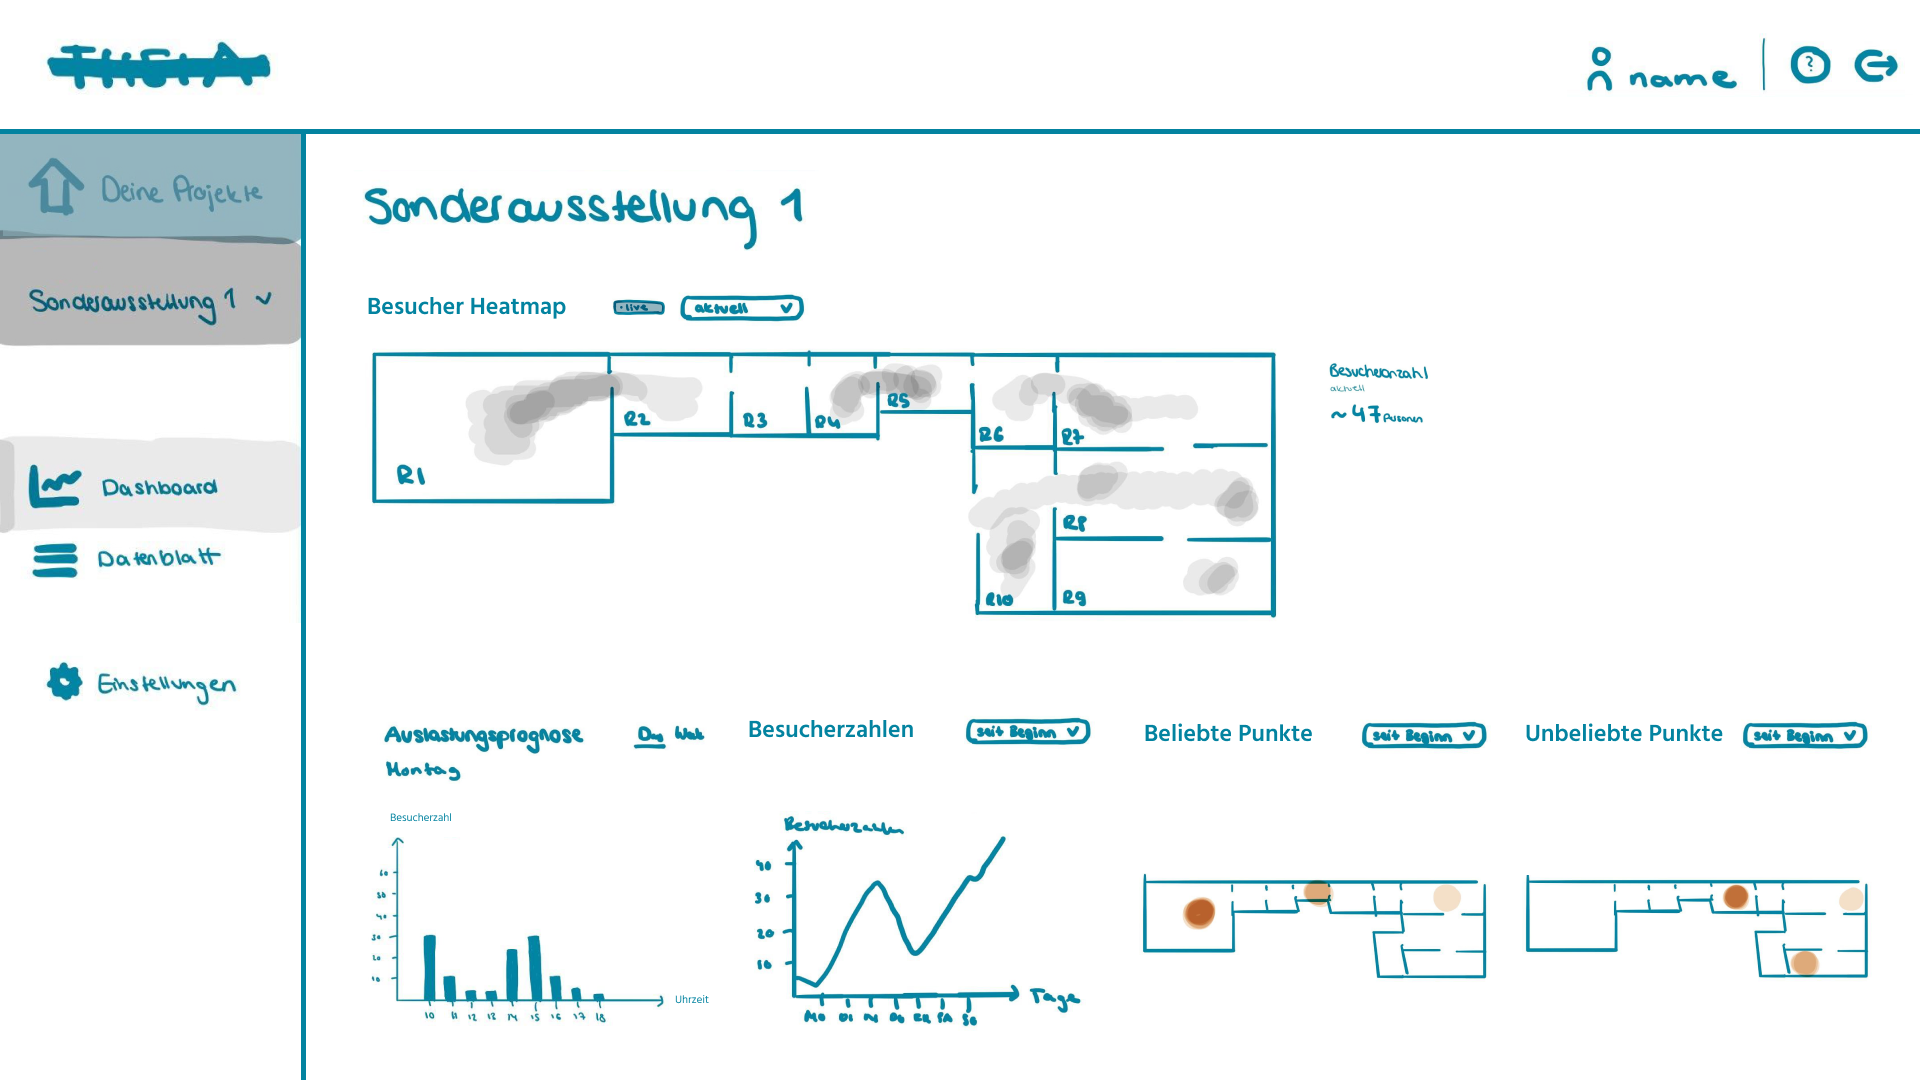
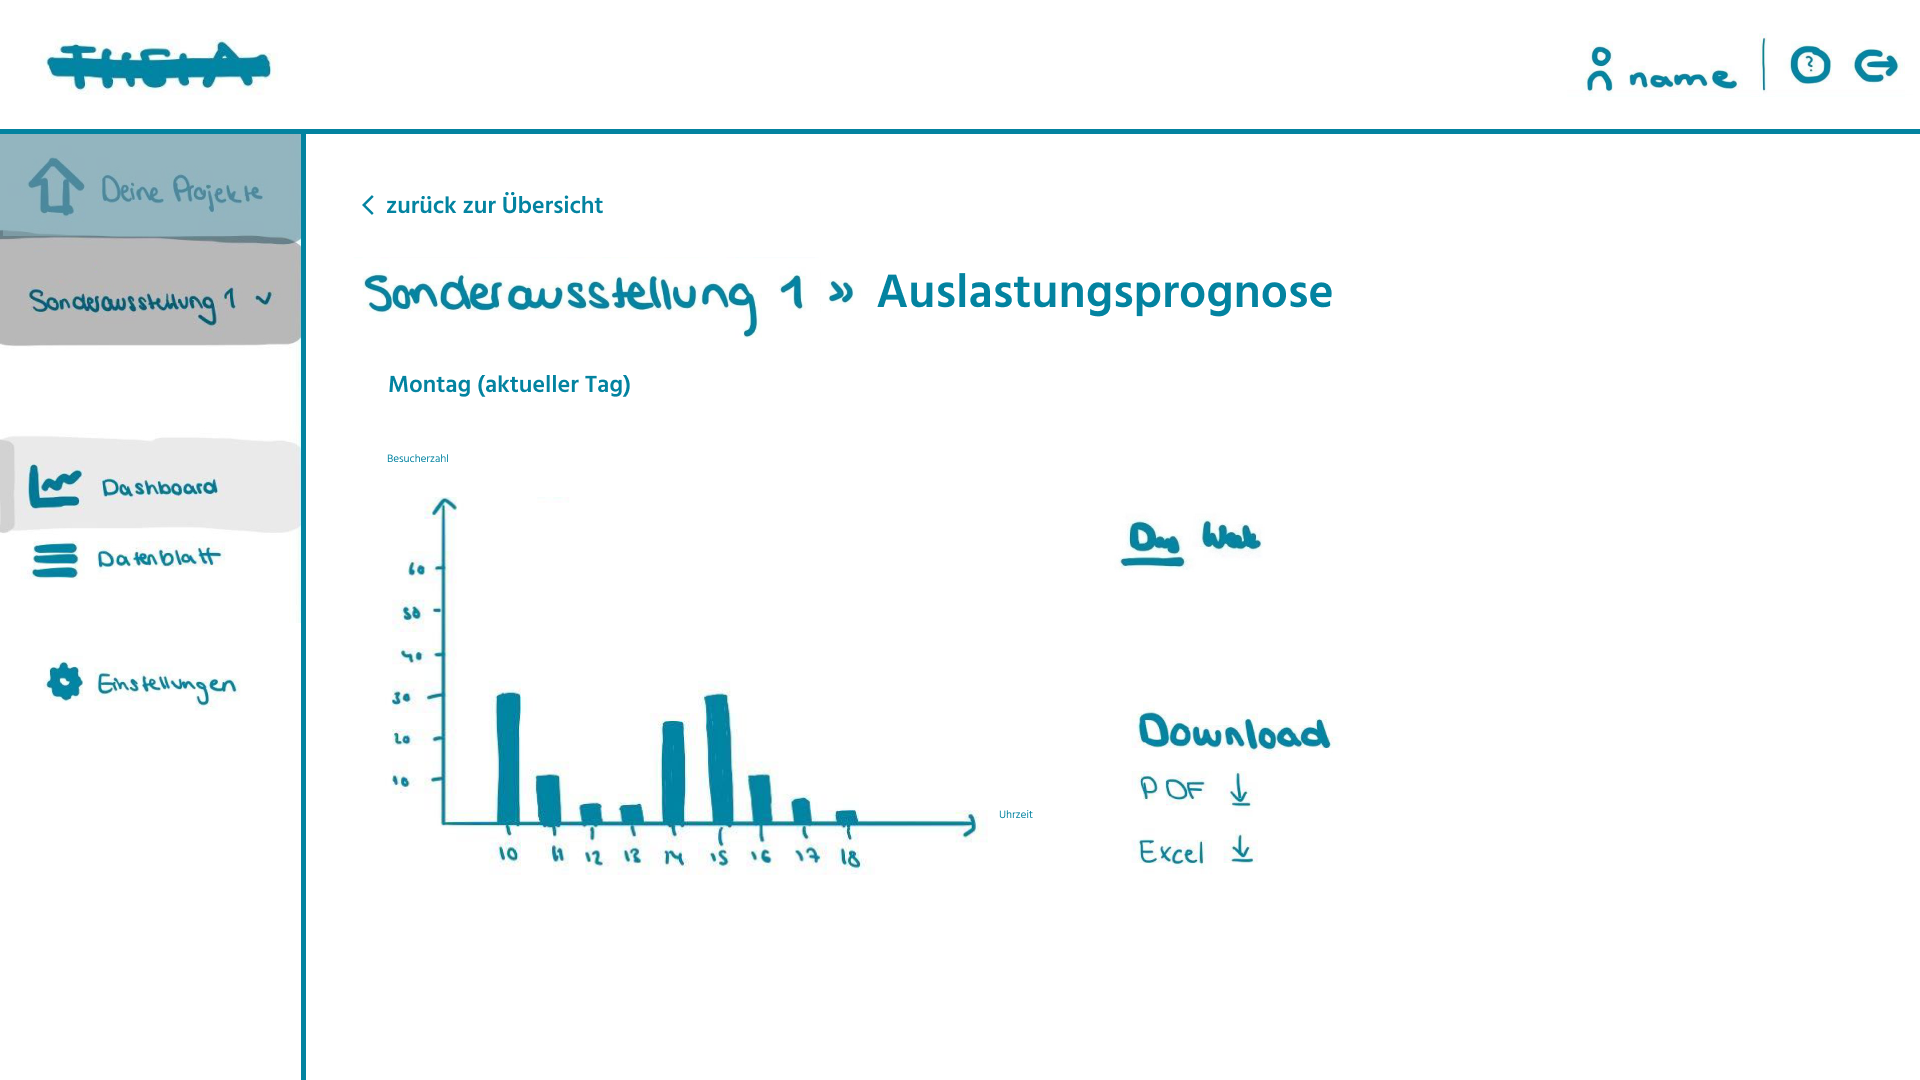
The Theia solution includes the Hi-Fi prototype dashboard, but also camera-based crowd tracking technology. The Hi-Fi prototype includes a map showing the distribution of visitors, charts of occupancy, number of visitors and most popular points, and the corresponding subpages.
Try the Hi-Fi prototype here: Theia Prototype
The crowd tracking system (not part of my work) behind the Theia Dashboard collects and processes real-time visitor numbers, location and movement data. In each room of the exhibition, a Raspberry Pi with a 160° camera module takes pictures every second. The camera images are processed using machine learning. First, the system recognizes a person in a single image and determines the position of their feet. Then, a specially developed algorithm analyzes several consecutive images and corrects the detected person's position accordingly. Finally, the system calculates the visitor's position in the room as accurately as possible.
Visit the project website for more information: theia-tracking.de
Project site for the closing presentation event: sichtraum.hs-augsburg.de